View Analytics & Export Data
Track how your popups are performing, see which prizes are being won, monitor revenue from discount codes, and export all subscriber data as a CSV file.
In this guide
1How to Access Analytics
There are two ways to view analytics:
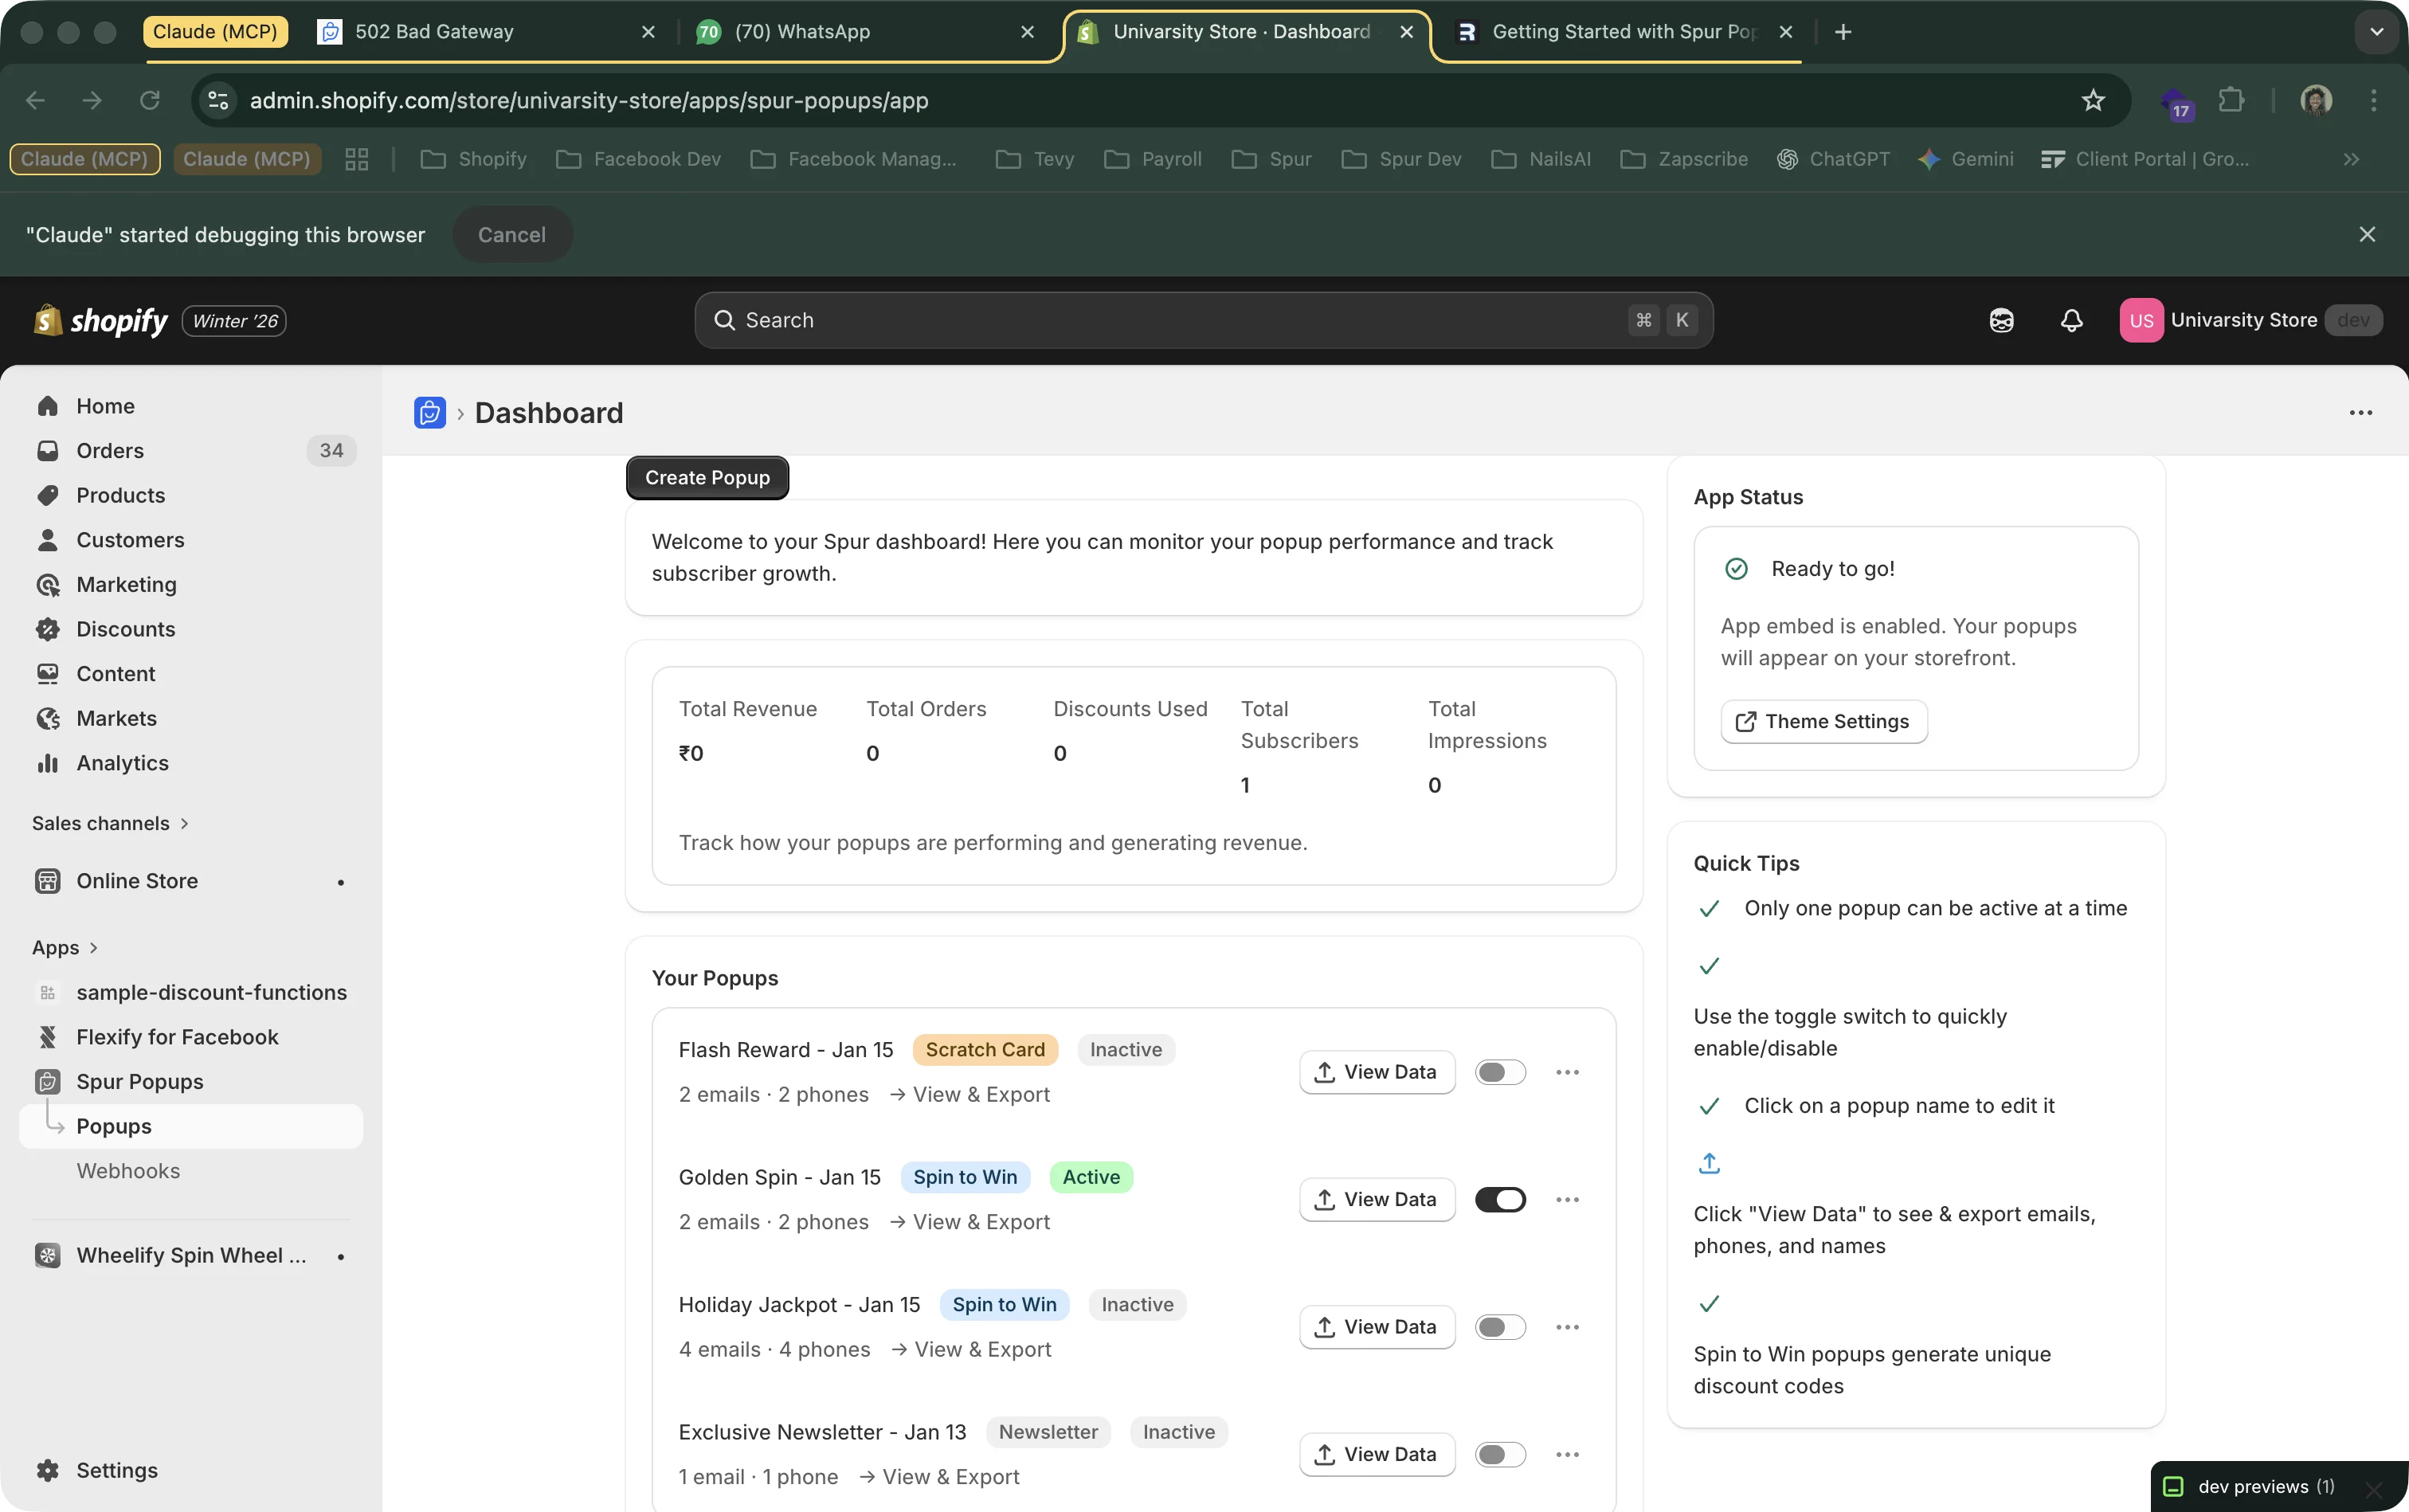
From the Dashboard
Click the "View Data" button next to any popup in your popup list. For Spin to Win and Scratch Card popups, this opens the full analytics dashboard. For Newsletter popups, it shows the subscriber list.
From the Popup Editor
While editing a popup, click the menu icon and select "View Analytics".
Newsletter vs. Gamified Popups
Newsletter popups show a simple subscriber list (email, phone, date, consent status).
Spin to Win & Scratch Card popups show a full analytics dashboard with revenue, conversion rates, prize distribution, and more.
2Dashboard Metrics (All Popups)
The main dashboard shows aggregate metrics across all your popups at the top:
Total Revenue
Total revenue from orders that used any popup discount code.
Orders
Number of orders placed using popup discount codes.
Discounts Used
How many popup-generated discount codes have been redeemed.
Subscribers
Total emails and phone numbers collected across all popups.
Impressions
How many times popups have been shown to store visitors.
3Individual Popup Analytics
When you click "View Data" on a Spin to Win or Scratch Card popup, you see a detailed analytics page:
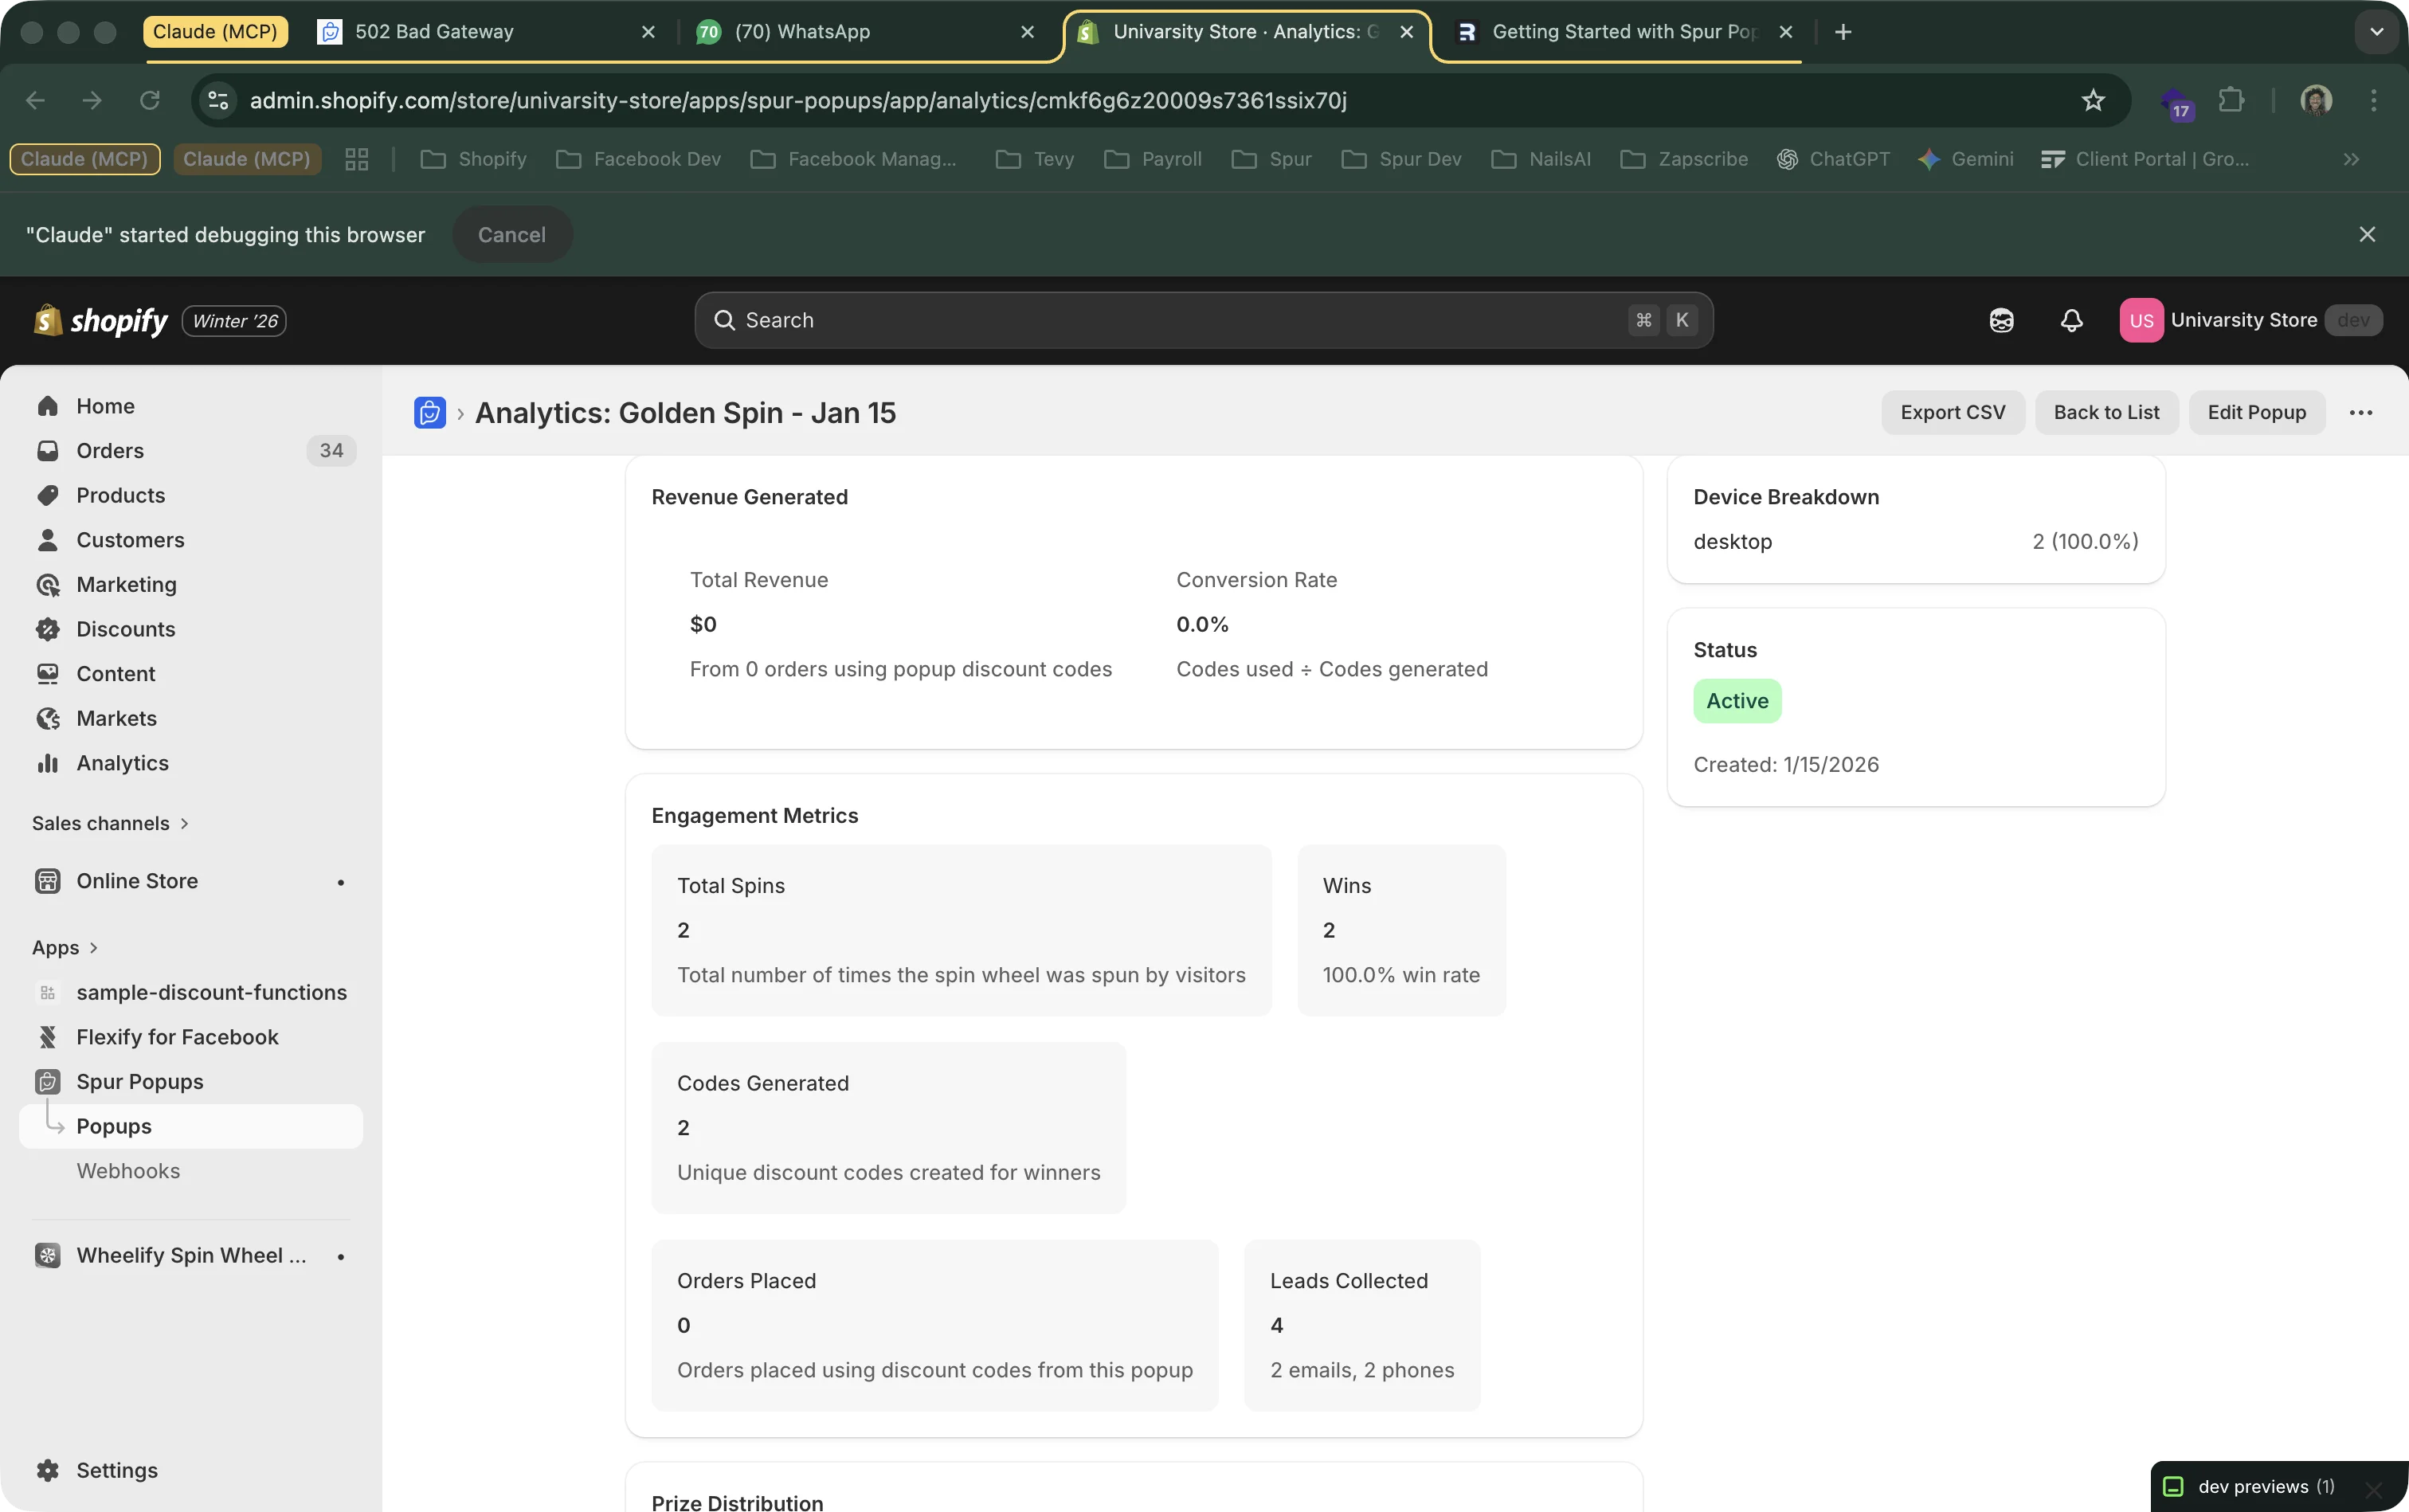
Revenue Metrics
Total Revenue
Revenue from orders using this popup's discount codes.
Conversion Rate
Codes Used / Codes Generated. Shows how many winners actually shopped.
Orders Placed
Total orders using this popup's codes.
Device Breakdown
Desktop vs. mobile submissions.
Engagement Metrics
Total Spins/Scratches
How many times the wheel was spun or card was scratched.
Wins
Number of plays that won a prize (excludes "Try Again" outcomes).
Win Rate
Percentage of plays that resulted in a prize.
Codes Generated
Total unique discount codes created for winners.
Leads Collected
Total emails and phone numbers collected.
4Prize Distribution
For Spin to Win and Scratch Card popups, the analytics page shows exactly which prizes were won and how often:
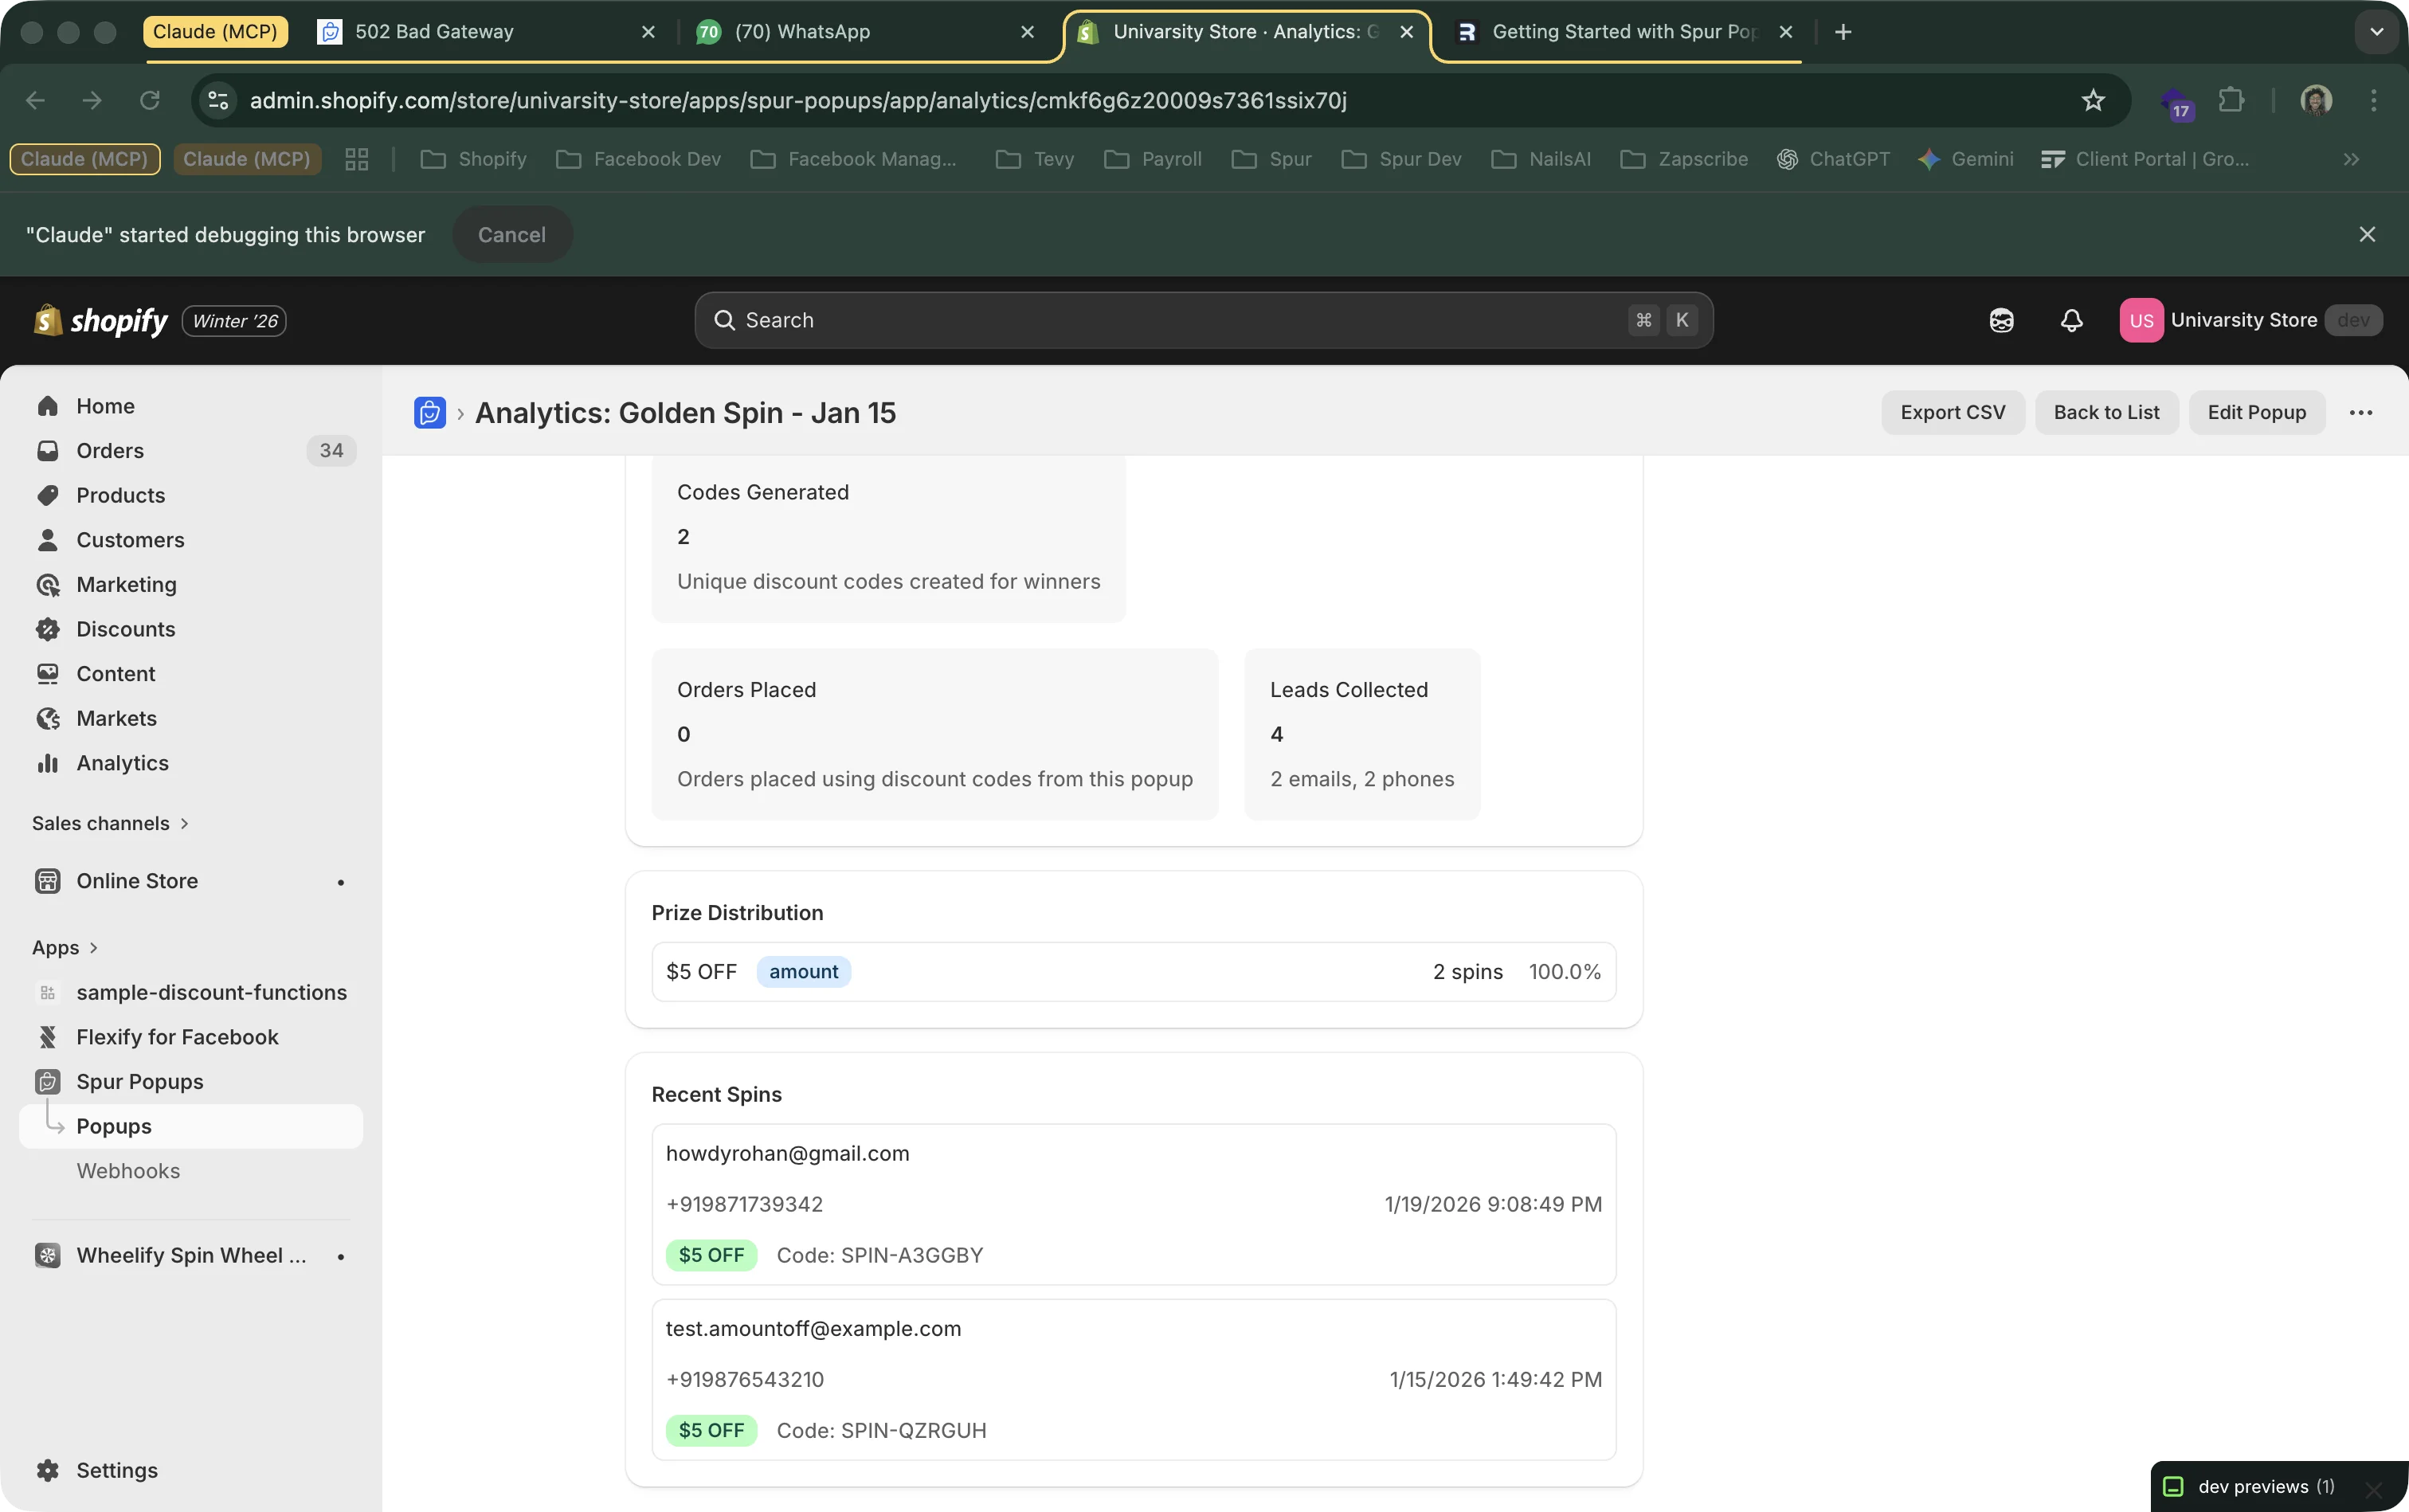
The prize distribution table shows:
- Prize label — What the visitor saw (e.g., "10% OFF", "$5 OFF")
- Prize type — Percentage, amount, free shipping, or custom code
- Times won — How many visitors won this prize
- Percentage — What % of total plays resulted in this prize
Use This Data to Optimize
If your conversion rate (codes used / codes generated) is low, visitors are winning codes but not using them. Try sending the code via WhatsApp to remind them, or increase the discount value to make it more compelling.
5Exporting Subscriber Data
Export all collected data as a CSV file to import into your email marketing platform, CRM, or spreadsheet.
How to Export
- Go to the analytics page (or subscriber list) for your popup
- Click the "Export CSV" button in the top right
- A CSV file downloads with all your data
What's In the CSV
- phone
- name (if collected)
- prize_won
- discount_code
- submitted_at
- device_type
- marketing_consent (email/sms/whatsapp)
Want real-time syncing?
CSV export gives you a snapshot. For automatic, real-time data syncing to your tools, set up webhooks to send subscriber data to Spur, Zapier, Klaviyo, or any other platform the moment someone completes your popup.
Recent Activity
Below the metrics, the analytics page shows a chronological list of recent submissions. Each entry includes:
- Email address and phone number
- Prize won and discount code generated
- When they submitted (timestamp)
- Whether the discount code has been used
This gives you a quick view of who's signing up and what they're winning without needing to export.